
A default set of Reflection Questions is applied to each new graph. To see those questions, go to the Graphs section, select an existing graph of the type you want to create (e.g., pie chart, bar graph, cumulative line), and click on Reflection Questions.
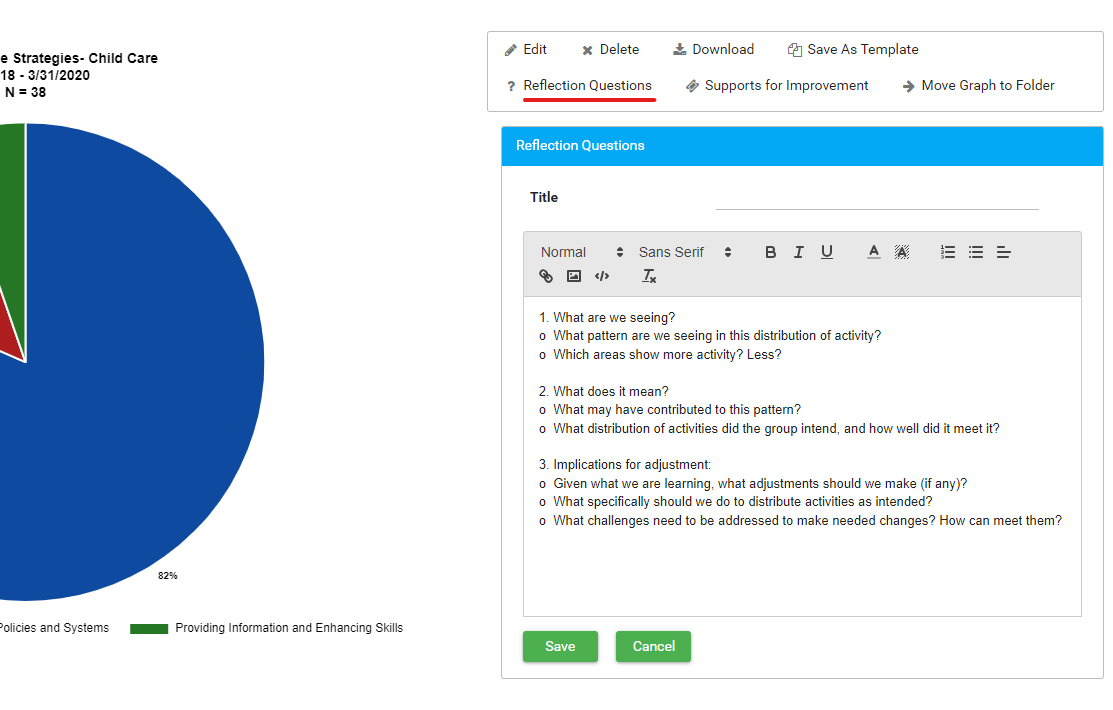
The default questions are all that most organizations need. Here is an example of default questions for a bar chart:
- What are we seeing?
- What pattern are we seeing in this distribution of activity?
- Which areas show more activity? Less?
- What does it mean?
- What may have contributed to this pattern?
- What distribution of activities did the group intend, and how well did it meet it?
- Implications for adjustment:
- Given what we are learning, what adjustments should we make (if any)?
- What specifically should we do to distribute activities as intended?
- What challenges need to be addressed to make needed changes? How can meet them?
If you need to add custom reflection questions, the instructions are below. Please be aware that the default questions will display along with any custom questions you add. Be sure to check out the existing default questions to make sure that you are not duplicating questions.
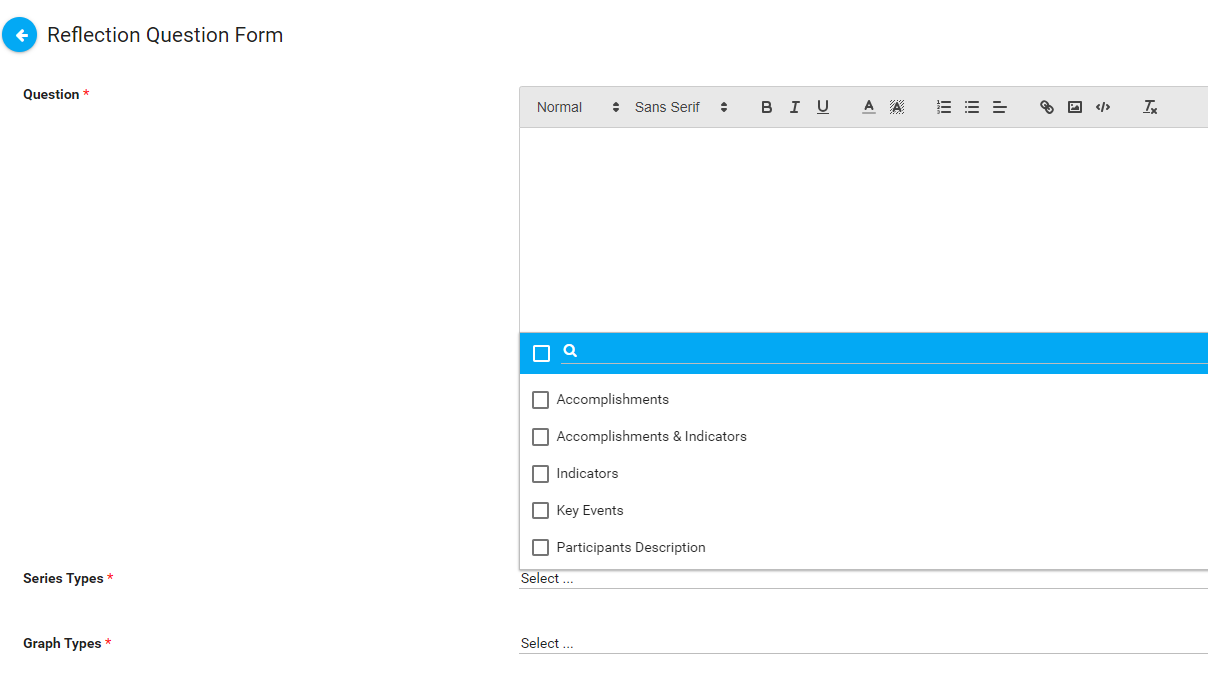
- Go to Administration > Reflection Questions..
- Click New to create a new question.
- Enter the formatted text you want to add for the Question.
- Select the Series Types associated with these questions, e.g., Accomplishments, Indicators, Key Events, Participants Description, etc. You may select more than one.
- Select the Graph Types where you want this new question to appear, e.g., pie chart, vertical or horizontal bar chart, cumulative on noncumulative line graph, etc.). You may select more than one.
- Click Save.