
Indicators are objective, population-level, numerical measures that can be useful in understanding community trends and assessing the impact of collective community action on longer-term outcomes.
Illustrative examples of Indicators include:
- Perceived availability of alcohol by youth
- Employment rates
- Infant mortality rates
- Voter turnout
- Number of low birth-rate babies
- Amount of youth participation
- Violent crime levels
- Number of hospital beds in use during Covid
Indicators can be graphed to determine changes in the measure over time, or they can be graphed in combination with Accomplishments to determine if there is a correlation between the level of Accomplishments and changes in the Indicator. Information from the Indicator database can also be exported into Microsoft Excel for further analysis.
Indicator Overview
Each Indicator includes several fields for specific information about the Indicator. These fields include:
- Category: An optional field for manual entry but required for batch imports. This field will often mirror the Topic Area.
- Data Source: The source of the data that you are entering (e.g., Dept. of Health and Human Services, U.S. Census, Behavioral Risk Factor Surveillance System, etc.).
- Indicator Name: The specific title of the Indicator (e.g., “Percent of Kansas 10th-graders reporting yes to 30-day use of alcohol in 2010”).
- Description: A brief sentence or two providing more detailed information about the Indicator and what it represents.
- Topic Area: The category that the Indicator relates to (for example, Health Behaviors, Substance Abuse Prevention, Preventive Care, etc.).
- Initiative: The specific initiative to which the Indicator is related.
- Geographic Level: An optional field allowing you to select the geographic level where the Indicator is taking place: City, State, Zip Code, County, or Census Tract. You can choose to enter a specific address, as well. Your project also has the option to create a custom geographic level (such as “Country” for global tracking) if the Indicator is not taking place in one of the predefined levels.
- Note: If you include this optional field for Geographic Level in your Indicator, you are then required to list all potential choices for that level. For example, if you set the Geographic Level as “County,” you are then required to include all potential responses in the County field, such as Douglas, Wyandotte, Johnson, Sedgwick, etc.
The fields mentioned above will always be included in an Indicator setup, but individual projects have an option of including additional customized fields relating directly to the information they would like to collect.
Setting Up a New Indicator
Before you start
- While Indicator data can be entered by anyone with Member/User-level access, setting up an Indicator is an Owner/Admin function.
- You must set up an Indicator first in the Administration section before data is either uploaded or entered manually. Make sure all potential dropdown options are available for Category, Data Source, Topic Area, Initiative, and Geographic Level. If you're being specific about which Geographic Level (i.e., County), make sure you set up all potential choices, such as: Douglas, Wyandotte, Johnson, Sedgwick, etc. If it's at the State level, for example, and there is only one option being used, be sure to set up "Kansas" or the designated state here first.
- The Indicator Name and the Description are text fields, meaning "write-ins," so they shouldn't have prepopulated choices set up in a dropdown.
- If you are importing data for your Indicator, which is the preferred method for entering Indicator data, it's essential that the text used for Indicator Name and Description matches exactly for each numerical data instance. That will group the numerical data together under the title of the Indicator.
- Instructions for entering Indicator data can be found here, under Member/User Help, including a downloadable template for the preferred method of Importing Indicator Data, as well as the steps for manual entry.
Setting up your choices
- Under the Administration section of your CCB, click on Indicators.
- If you have not set up any Indicators in this CCB yet, you will see a blank table like this:
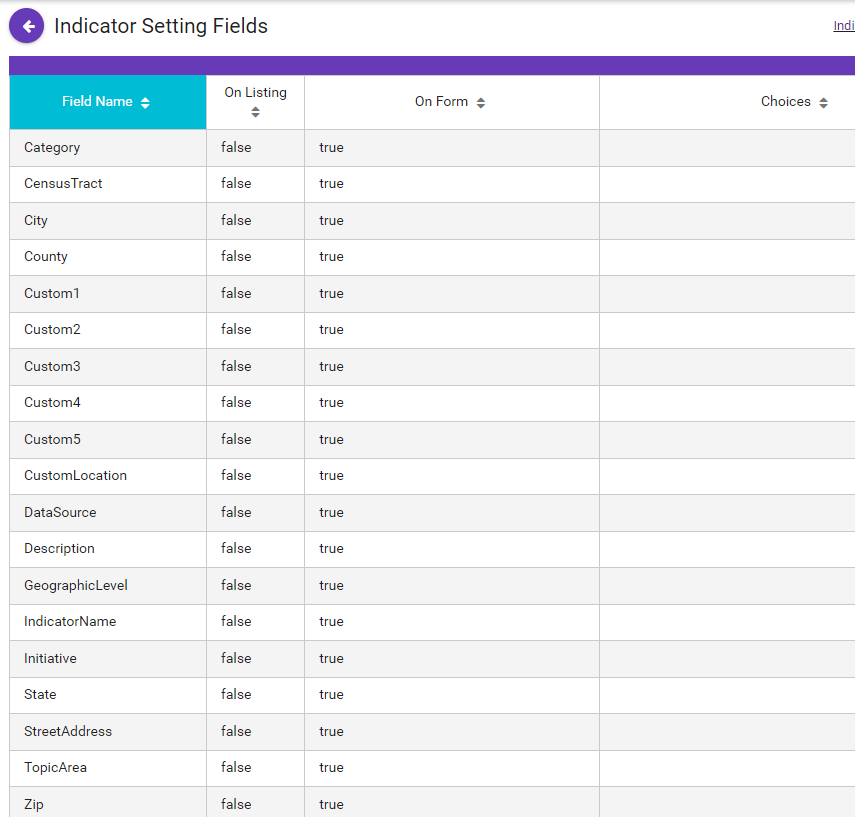
- Clicking on any of the Field Names, such as DataSource, will give you a popup where you can enter all potential choices for Indicators in this CCB, plus any Help prompts.
- Note: It is not recommended that you enable "Text line entry for other available," since you will not be able to graph those text entries.
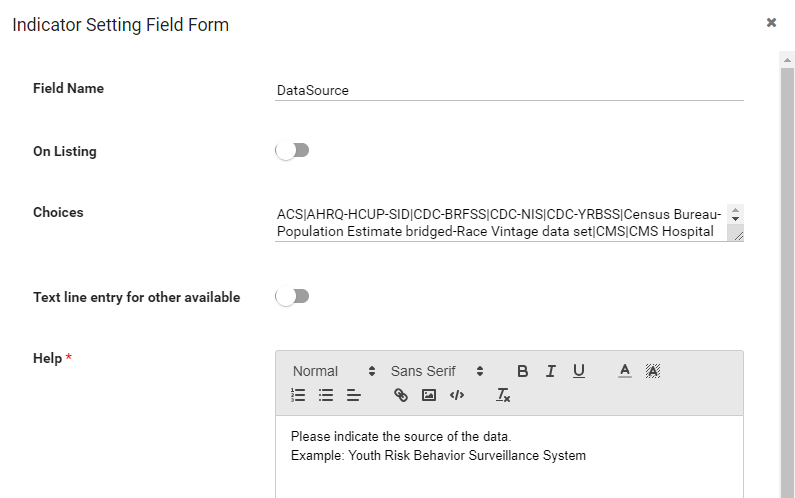
- Separate each choice by using the pipe "I" (which is the uppercase character on your keyboard for the "\" character). This is just as you would do for entering Accomplishment choices for dropdowns or multiselect questions.
- Note: Be sure there are no spaces on either side of your pipe. This will absolutely cause issues with graphing and internal calculations. Also be sure there is no pipe character at the end of your list of choices. Putting a pipe at the end of the options will create a "blank" choice following that pipe. This will also cause issues with graphing and calculations.
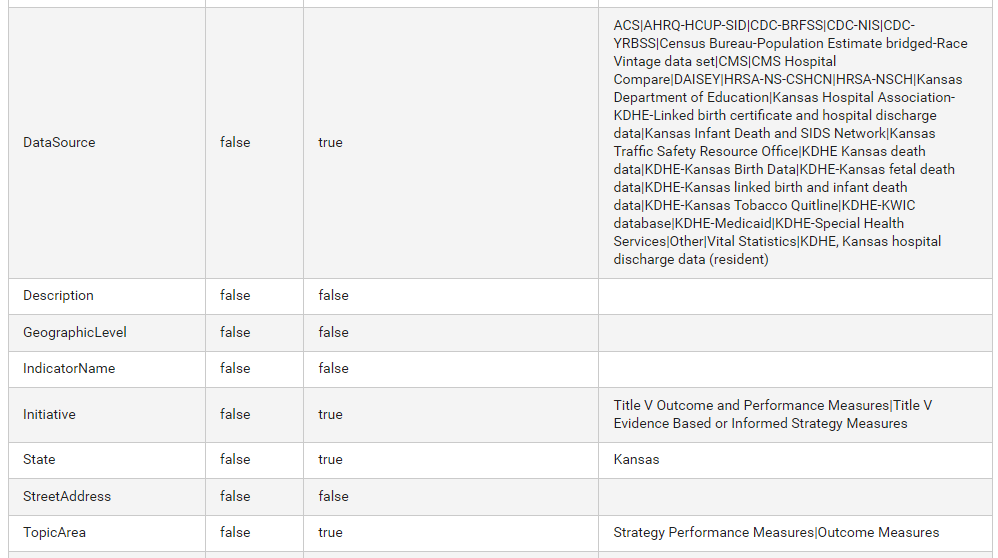
- When you're finished, your table should look something like this:
- Note: It is not recommended that you enable "Text line entry for other available," since you will not be able to graph those text entries.
- After you have set up all of your choices, you are now ready to import your data (the preferred method). Please refer to the Import New Indicator Data section under Member/User Help.
Completing the Indicator Data Import
- Once you have your data with the headers in a saved Excel doc, it is ready for import.
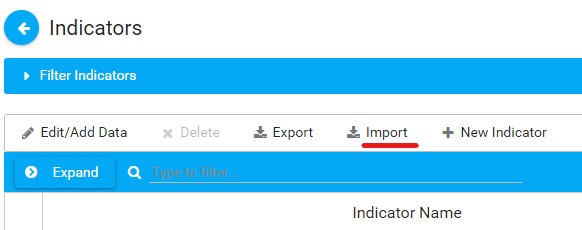
- In the upper (non-Administrative) section of the sidebar in your CCB, click on Indicators.
- Click the Import button in the menu bar:
- Choose the Excel file locally from your computer and upload it.
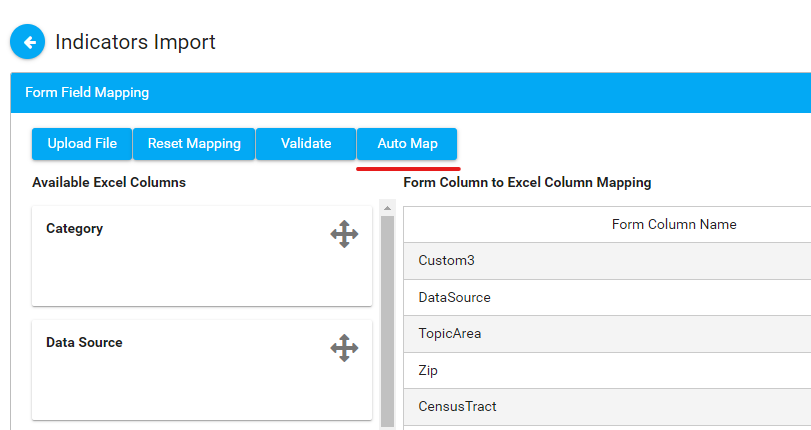
- After that, you'll see the Form Field Mapping interface. Click on Auto Map first, which will automatically map most fields from the Available Excel Columns on the left to the Excel Column Name on the right.
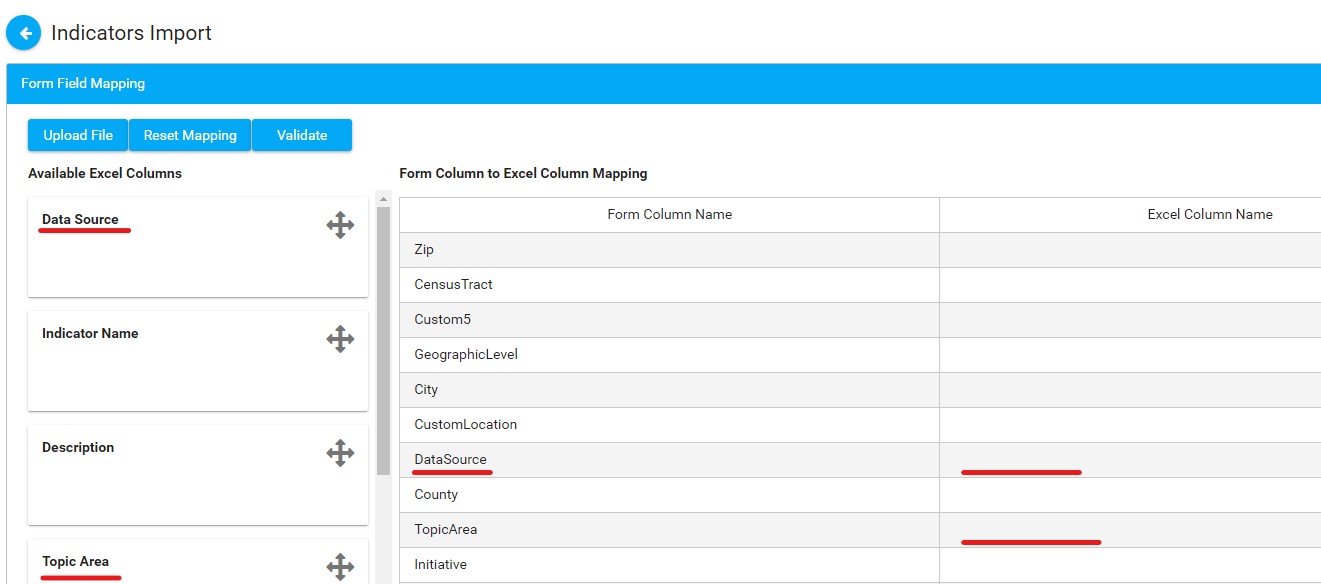
- Drag and drop any remaining fields from the left column to the corresponding fields on the right column. This is similar to the Accomplishments Import process. (Click the image below to open it full-sized in a new browser tab.)
- Once you've finished all of the mapping, click Validate. If there are any errors, correct them. If not, click Upload File. You should see an "Import Successful" prompt after that.