
Indicators are objective, population-level measures that can be useful in understanding community trends and assessing the impact of collective community action on longer-term outcomes. Indicators provide broad markers to help assess the impact of your work on longer-term outcomes in your community.
Illustrative examples of Indicators:
- Perceived availability of alcohol by youth
- Employment rates
- Infant mortality rates
- Voter turnout
- Number of low birth-rate babies
- Amount of youth participation
- Violent crime levels
Indicators can be graphed on their own to determine changes in the measure over time, or they can be graphed together with Accomplishments to determine if there is a correlation between the level of Accomplishments and changes in the Indicator. Information from the Indicator database can also be exported into Microsoft Excel for further analysis.
Indicator Overview
- Each Indicator includes several fields for specific information about the Indicator. These fields include:
- Category: The category names of your Indicators for helpful grouping.
- Indicator: The name/title you designate for a specific Indicator (e.g., Percent of Kansas 10th-graders reporting "yes" to 30-day use of alcohol in 2018).
- Data Source: The source of the data you are entering (e.g., Department of Health & Human Services, U.S. Census, Behavioral Risk Factor Surveillance System, etc.).
- Initiative: The specific initiative to which the Indicator is related.
- Topic Area: The topic the Indicator relates to (for example, Health Behaviors, Substance Abuse Prevention, Preventive Care, etc.).
- Description: This provides more detailed information about the Indicator and what it represents.
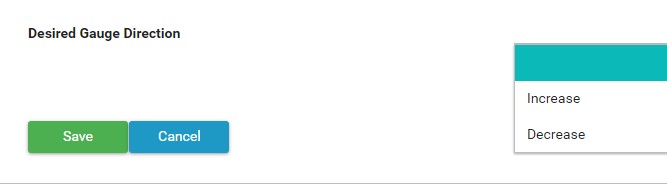
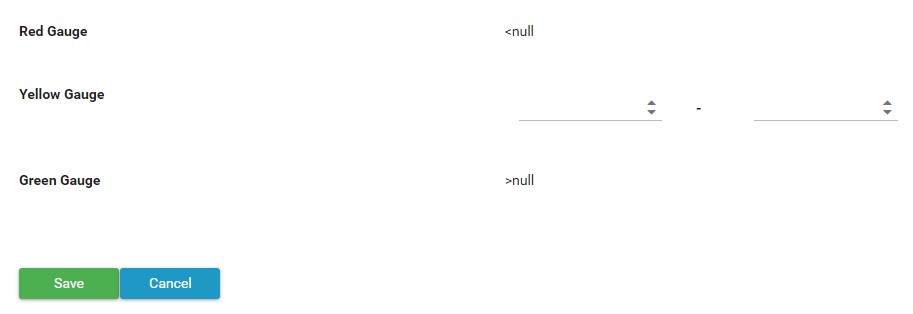
- Gauges: You have the option to generate a visual icon (green, yellow, or red) next to your indicator that depicts at a glance whether or not the numbers are on a favorable or unfavorable trajectory overall. Green indicates favorable results, yellow indicates a minimal amount of change (or neutral), and red indicates an unfavorable trajectory. When setting up your gauge, you determine what the neutral (yellow) range will be and whether or not an increase or decrease is desired. Anything "greater than" the desired number entered in your neutral range will be green. Anything "less than" the desired number entered in your neutral range will be red.
- Geographic Level: This box allows you to identify a geographic level: City, State, Zip Code, County, or Census Tract. You can also enter a specific location/address. In addition, you have the option to add a custom level (such as "country"), if the Indicator is not taking place in one of the established options.
- These fields will always be included in the Indicator, and individual projects also have the option of adding five additional fields that are customized to the information they would like to collect.
View Indicators
- Your site owner should have already set up Indicators for you. If you don't see any Indicators or need to add a new one, please check with your site owner.
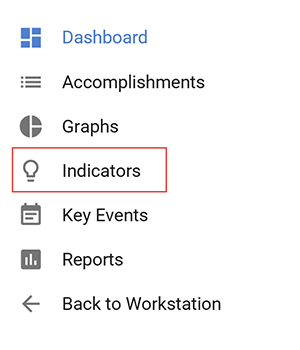
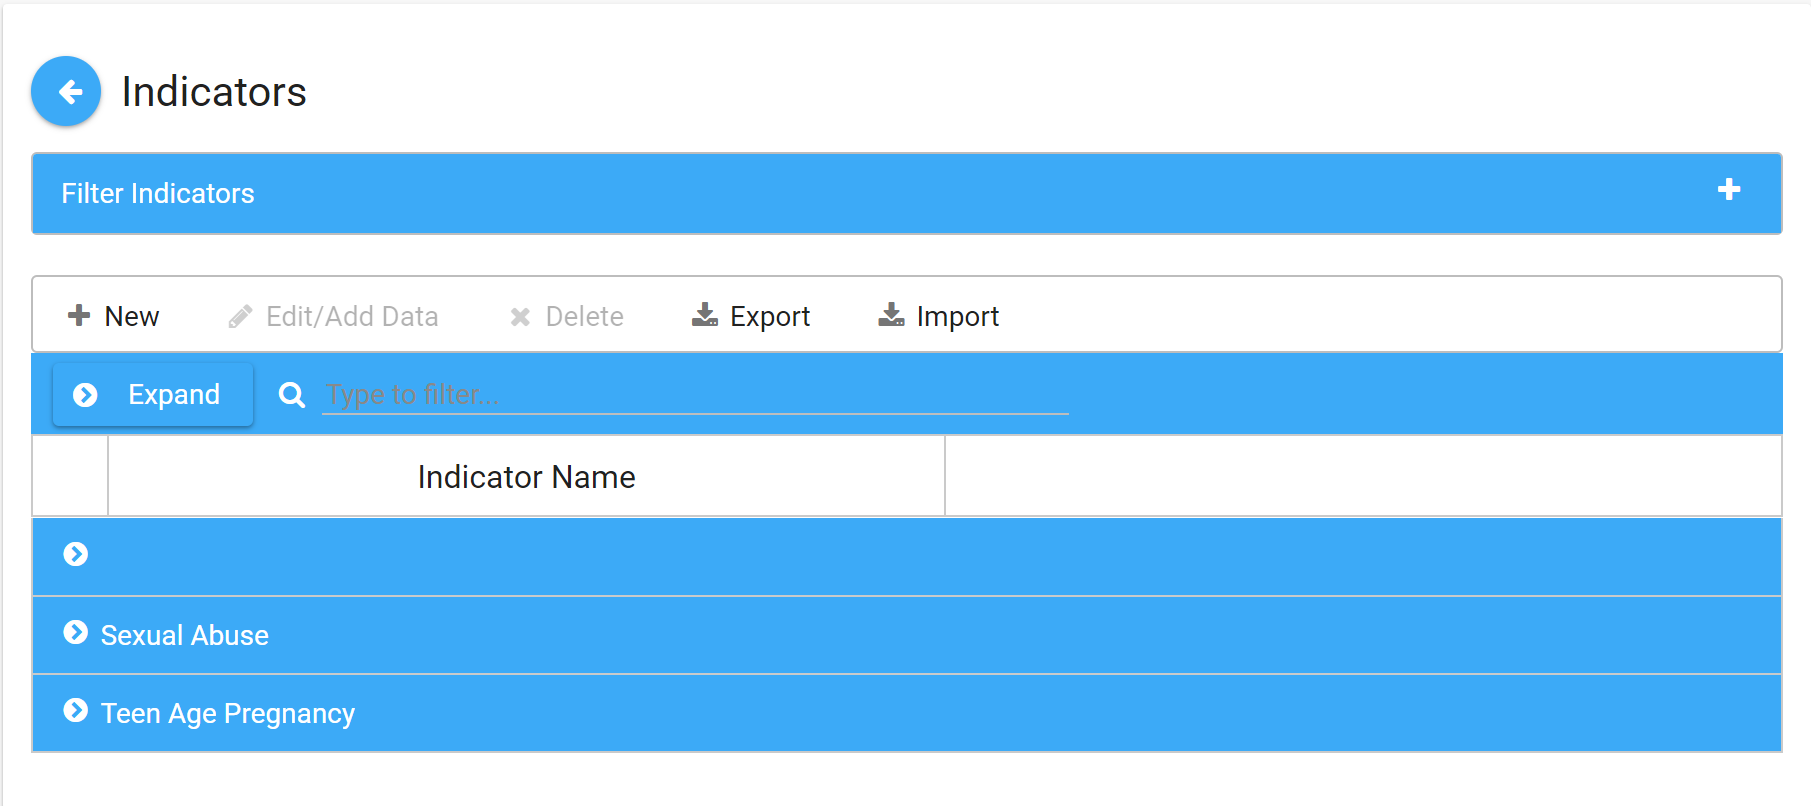
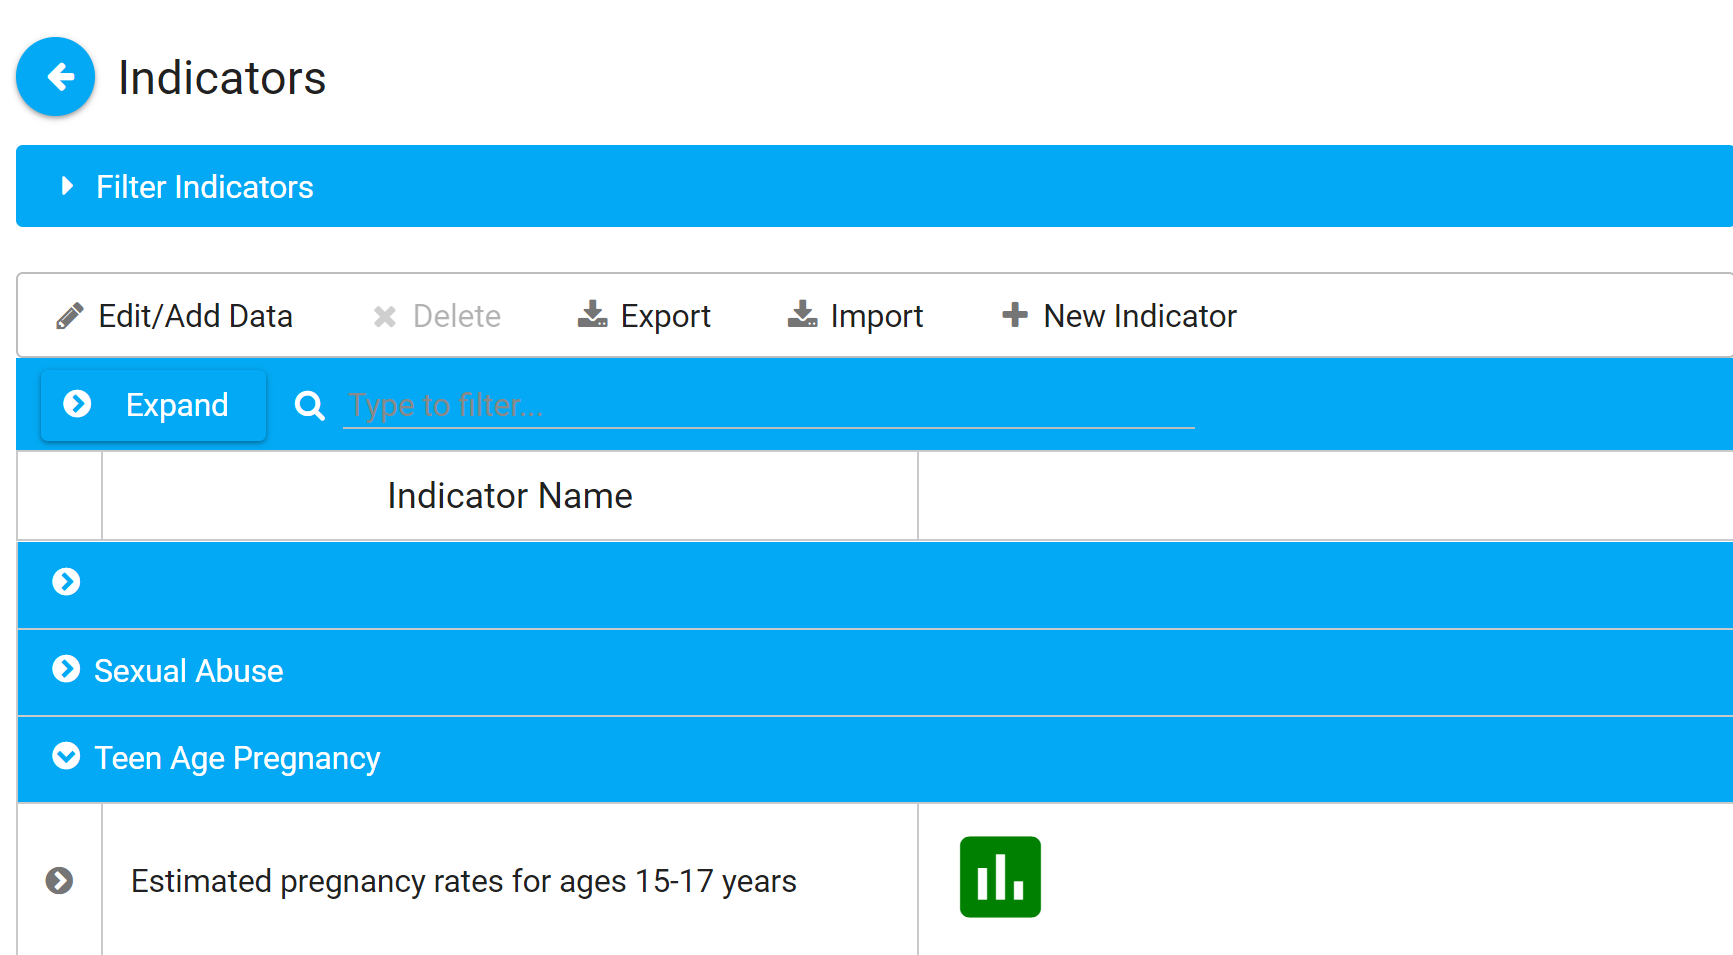
- To view Indicators, click on Indicators in the left navigation bar. This will take you to the Indicators listing page.
- To view the existing indicator data, click on the > to the left of the indicator you want to view. This will display all existing data for that indicator.
- From this page you can add data or make edits to existing indicators, or filter to view just what you want.
Enter New Indicator Data
- Click on Indicators in the left navigation bar. This will take you to the Indicators listing page.
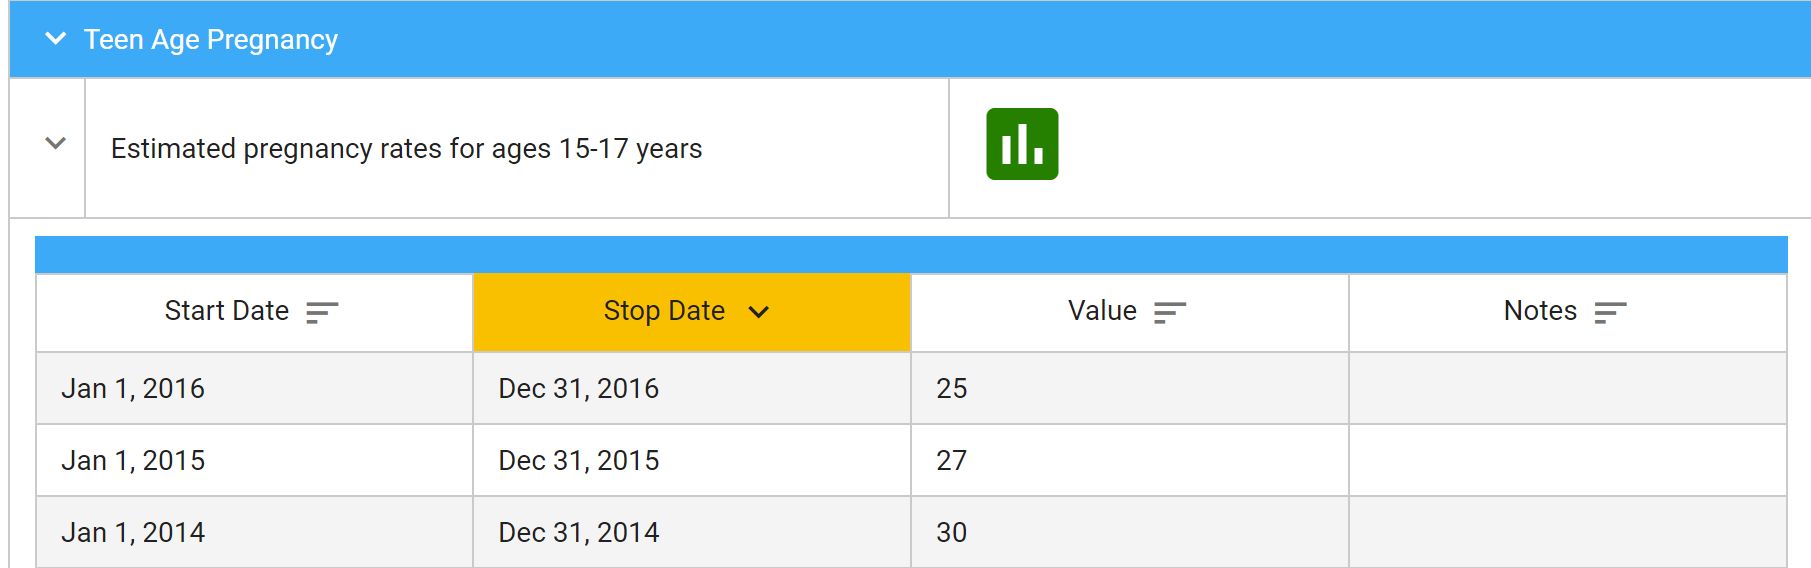
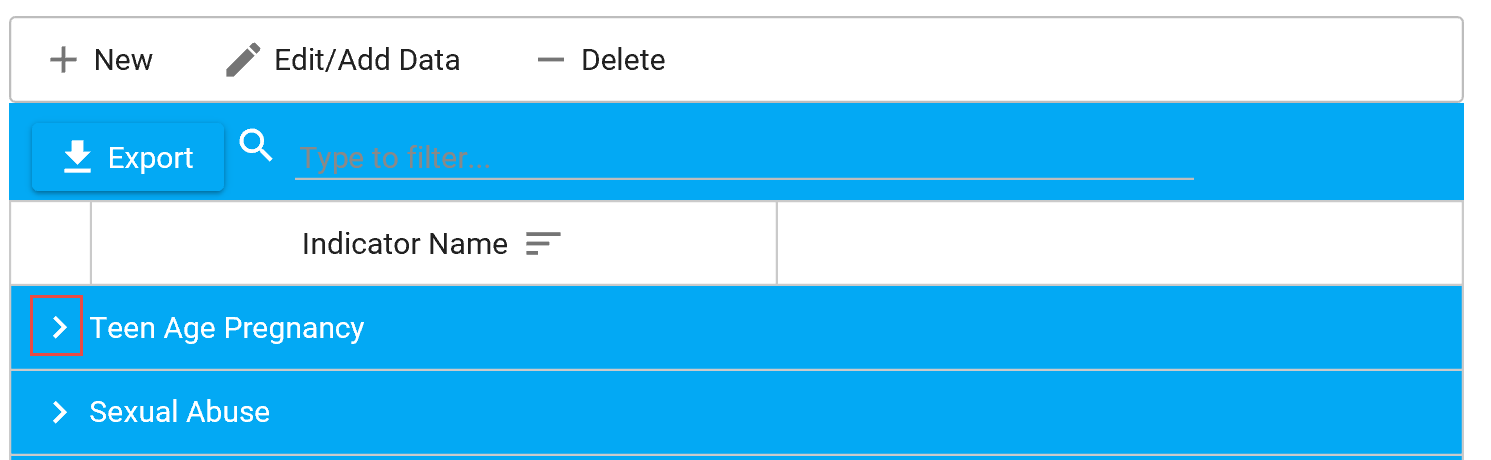
- Click on the > to expand the category (e.g., Teen Age Pregnancy)
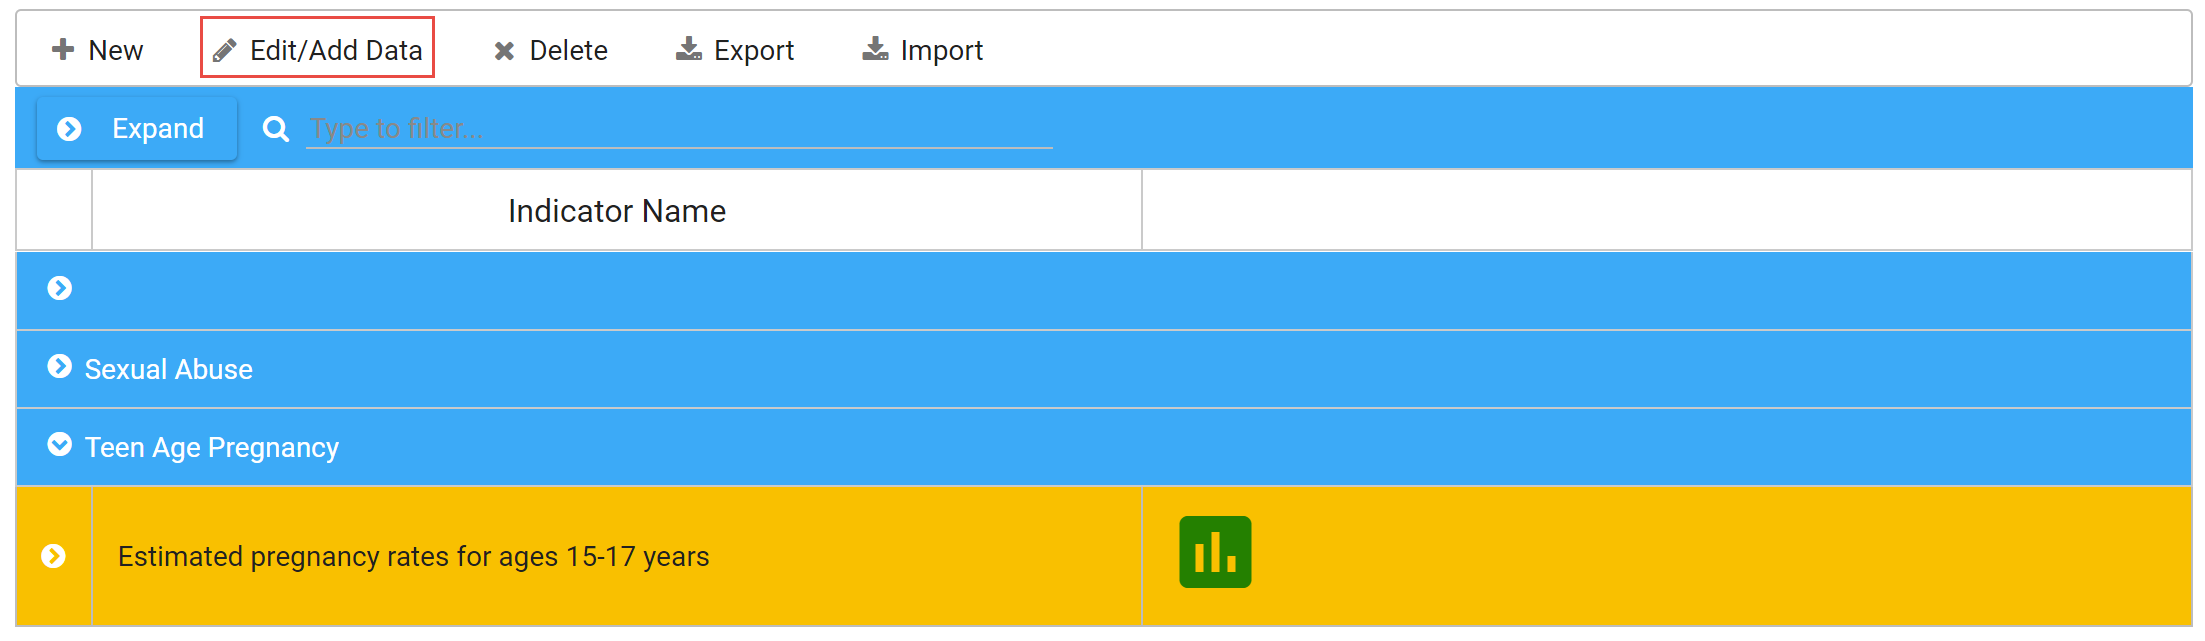
- Click on the category (e.g., Estimated pregnancy rates for ages 15-17 years), and then click Edit/Add Data.
- Click the Add button at the bottom of the page.
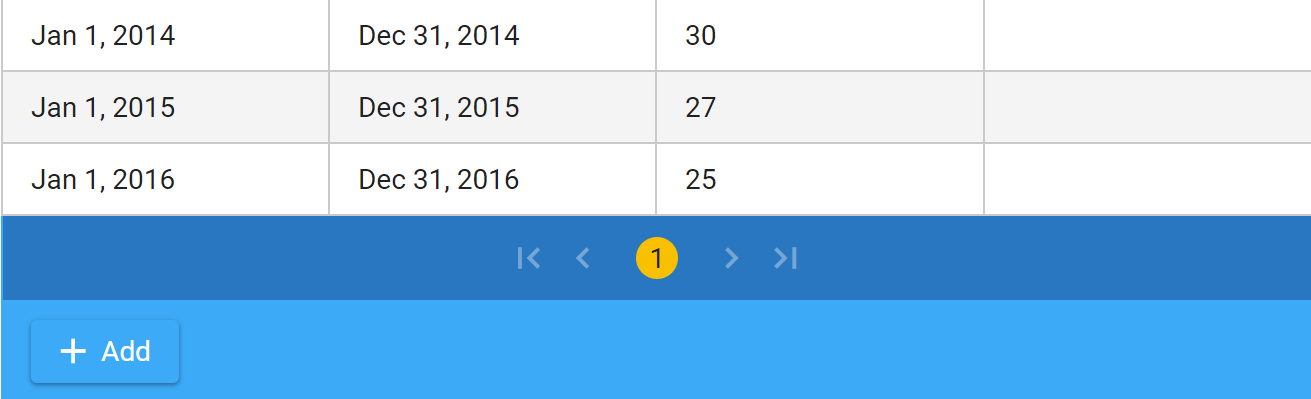
- Enter the Start Date, Stop Date, Value, and Notes (optional) for the current time period.
- Click Save.
- If you decide not to make any additions or changes to the Indicator, click Cancel to leave the entry without making any changes.
Edit Existing Indicator Data
- Indicators that have been created should have all relevant information already filled in. But if you need to revise your data, please follow these instructions:
- Click on Indicators in the left navigation bar. This will take you to the Indicators listing page.
- Scroll to the category you want to update, e.g., Teen Age Pregnancy.
- Click on the > to expand the category (e.g., Estimated pregnancy rates for ages 15-17 years).
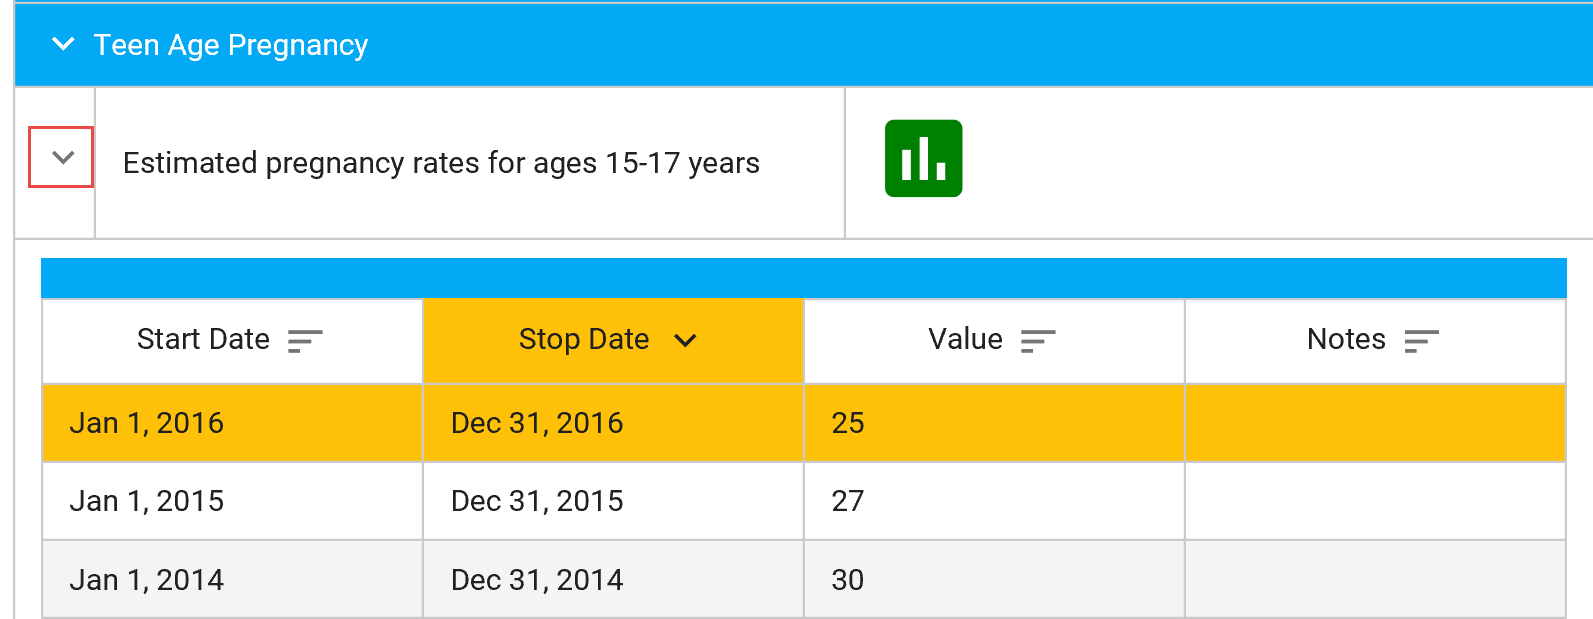
- Click on an existing entry to edit.
- Make the edit and click Save.
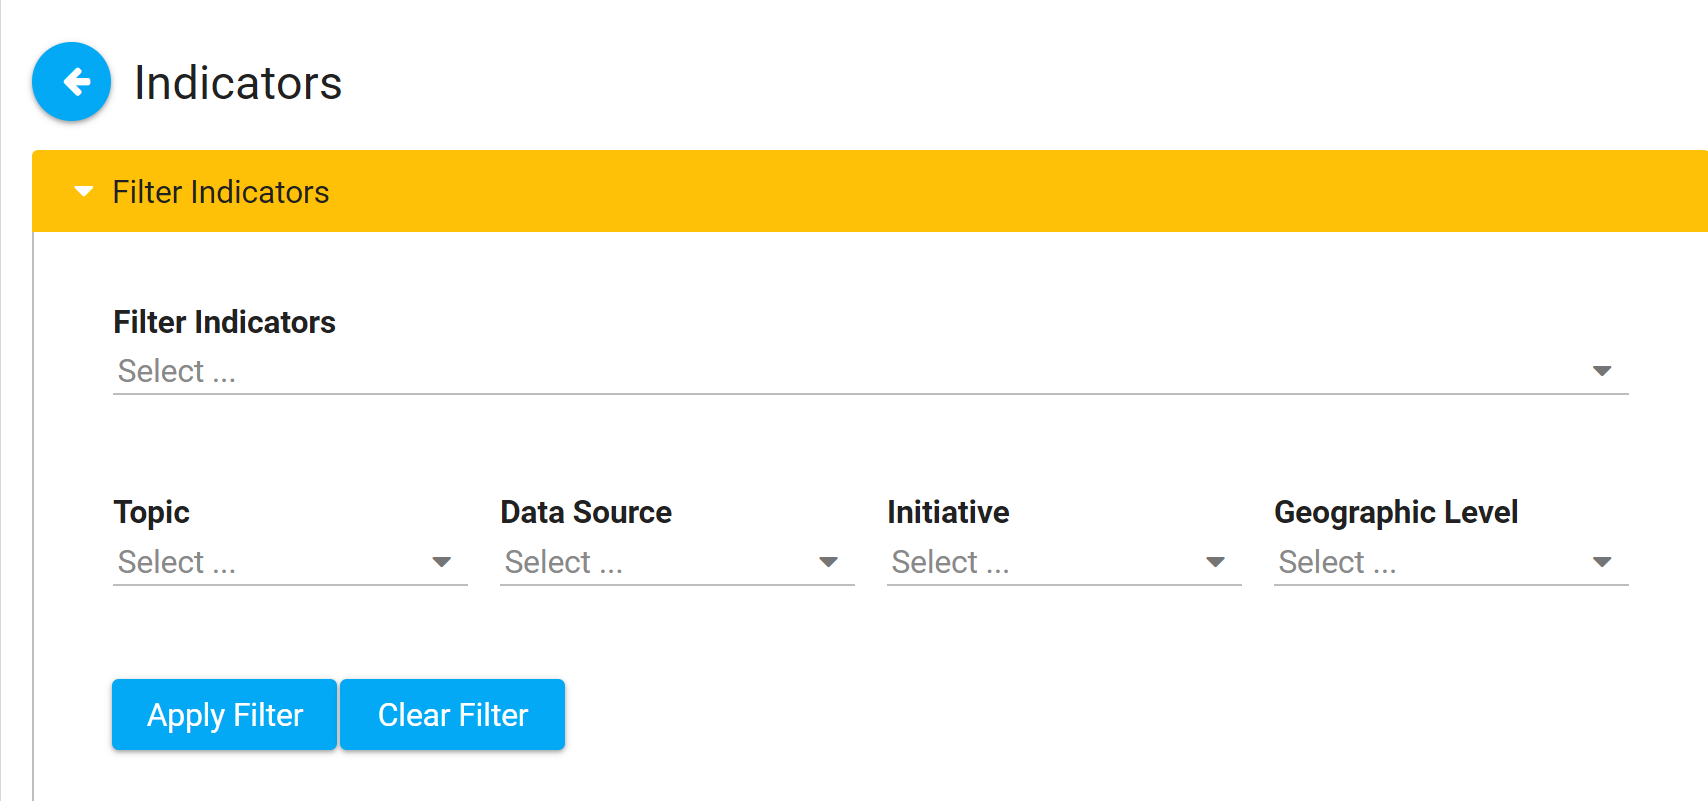
Filter Indicator View
- You can select from the follow filters to choose what data you view:
Export Indicators
- Click on Indicators on the left navigation bar.
- If you want to export all Indicators, click Export.
- If you want to export specific entries:
- Click Filter Indicators and select the filters you want,
- Click Apply Filter.
- Click Export.
Import New Indicator Data
- NOTE: Only Site Owners/Administrators and KU staff have the ability to import Indicator data, which can be set up first in Excel by anyone (Member/User or Owner/Admin.)
- Download this Indicator Import Template (.xlsx) for populating your data. This document includes sample data as guidance, which should be removed.
- The name of your indicator (Indicator Name) is an open text field, not prepopulated from existing values predetermined and set up by an Owner/Admin in a dropdown list. It should be whatever you wish to call this new Indicator, and the name should remain consistent for each entry (see example Excel doc). Most of the other data will be replicated in each entry as well, with the exception of the last four columns: Start Date, Stop Date, Value, and Notes. Those are different in each row/entry.
- All of the columns are required for import, with the exception of "Geographic Level" and its related/triggered columns. If Geographic Level is filled out (use "County," "City," "State," or a custom location such as "Country" as your entry in that field), the corresponding column for either County, State, City, or your Custom Location should be filled in as well. It becomes a required field. So you would put "Chicago" (as an example) in your City field if you put "City" as the identifier under Geographic Level.
- Even though all of these column headers are required for import, it is not necessary to include any data in the "Notes" field, either. Make sure the header is included, however, or it will cause an error during import.
- Additional columns/data may be included if desired, but the ones listed on the example Excel document are required.
- Once you finish entering your data in a saved Excel doc, it is ready for import. You may include more than one indicator in the same Excel document. They will automatically be grouped together in the CCB upon import, based on the Category and the Indicator Name, so make sure those match (exactly) for each indicator included.
- After that, please contact a Site Owner/Admin or KU staff member to complete the import for you.