
Navigation
The navigation bar on the left of your screen will help you move quickly and easily between Accomplishments, Indicators, Graphs, Key Events, etc.. If your site has collaborative features, you will also see a “Back to WorkStation” link.
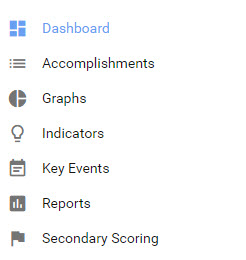
Accomplishments
- If you only have one CCB form, then clicking on Accomplishments will take you to the list view of existing Accomplishments.
- If you have multiple CCB forms, then you will select the appropriate form from a drop down list.
Graphs
- Takes you to a list of existing graphs and also allows you to create new graphs and new folders.
Indicators
- Takes you to a list of existing indicators and allows you to create or update indicators.
Key Events
- Takes you to a list of existing key events and allows you to create or update key events
Secondary Scoring
- Allows accomplishments to be reviewed and scored.
Back to WorkStation
- This “return” feature can be customized by an administrator to take users back to any URL. Typically, it takes users to the site collection of the CCB. If the CCB is the only component in your collection, you will be returned to the main page of myctb.org.
Hide or View navigation bar
When you initially view your CCB, the navigation bar pictured above should be expanded. You can close it by clicking on the circle and left arrow shown in the image below.

Dashboard
The dashboard gives you a quick look at how you are doing, and gives you another way to navigate to some features. You will see live accomplishment data displayed in three boxes across the top. Below that are action buttons to enter and view data.
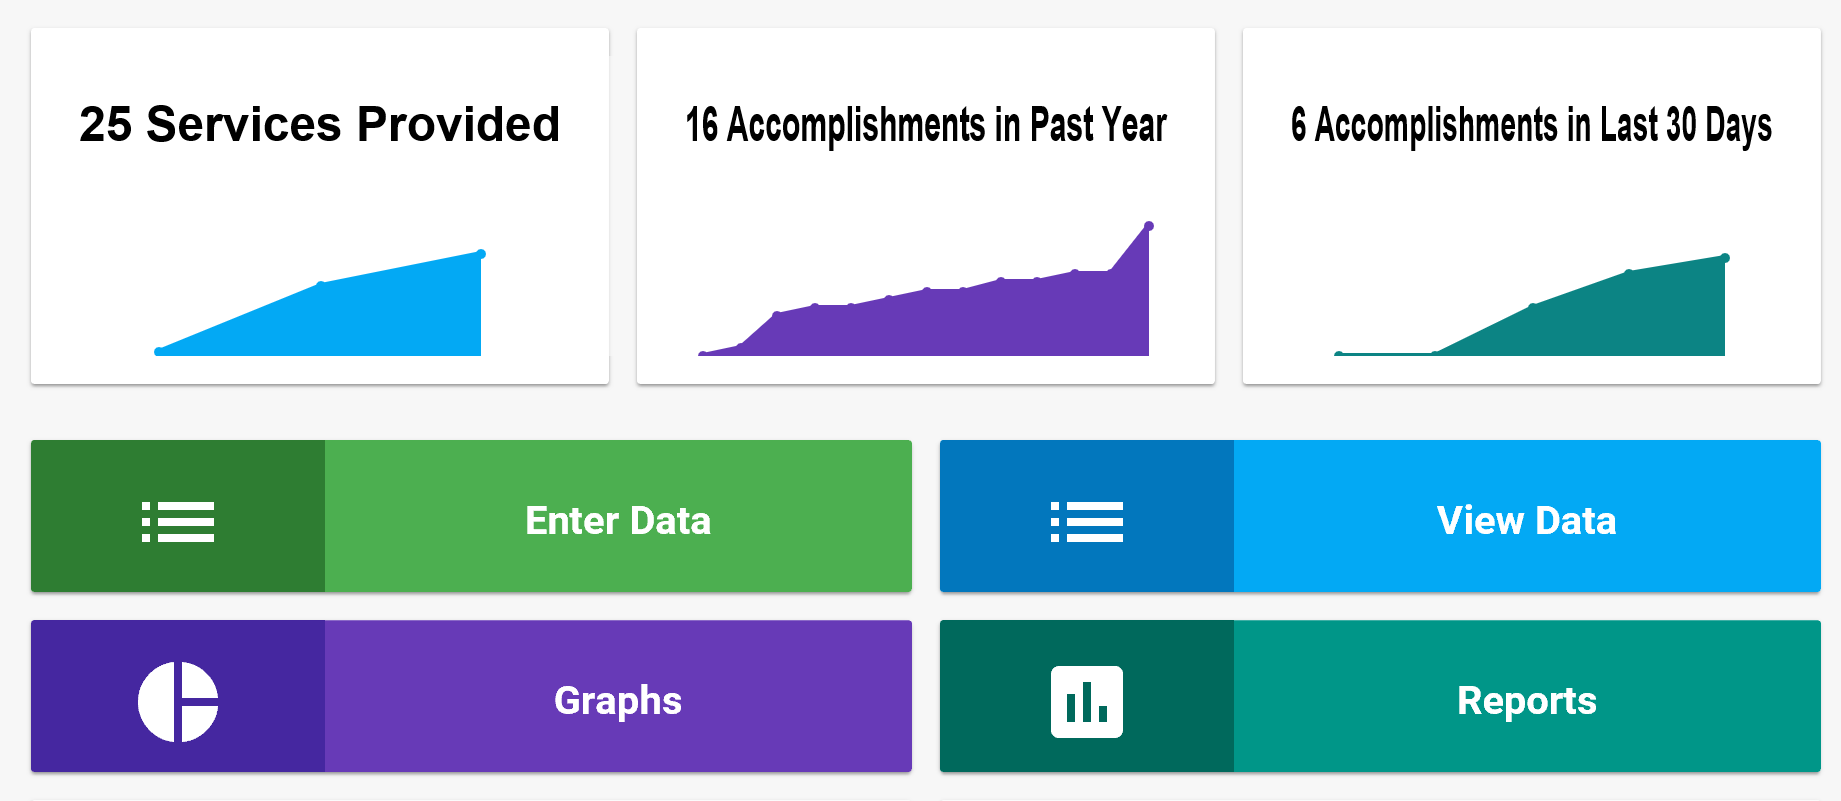
Live accomplishment data counts and graphs
- Community Changes displays the total number of accomplishment entries for the code you wish to view (e.g., Community Change). This cumulative line graph will display the code entries year by year. If data collection has been occurring for less than two years the display will be month by month.
- Accomplishments in Past Year displays numbers for the last 365 days in a cumulative line graph.
- Accomplishments in Last 30 Days displays all accomplishments completed in the last 30 days in a cumulative line graph.
Action buttons
Using the four action buttons below the graphs allows you access accomplishments, graphs and reports:
- Enter Data takes you directly to a new accomplishment so you can quickly enter your data. More info on Accomplishments.
- View Data takes you to a list of previously entered accomplishments. You can customize how the data displays on this page.
- Graphs takes you to a page that displays a list of existing graphs and also allows you to create new graphs and new folders.
- Reports takes you to a page that displays a list of existing reports and also allows you to create new reports.